Aufgaben zu Differentialgleichungen
Werbung

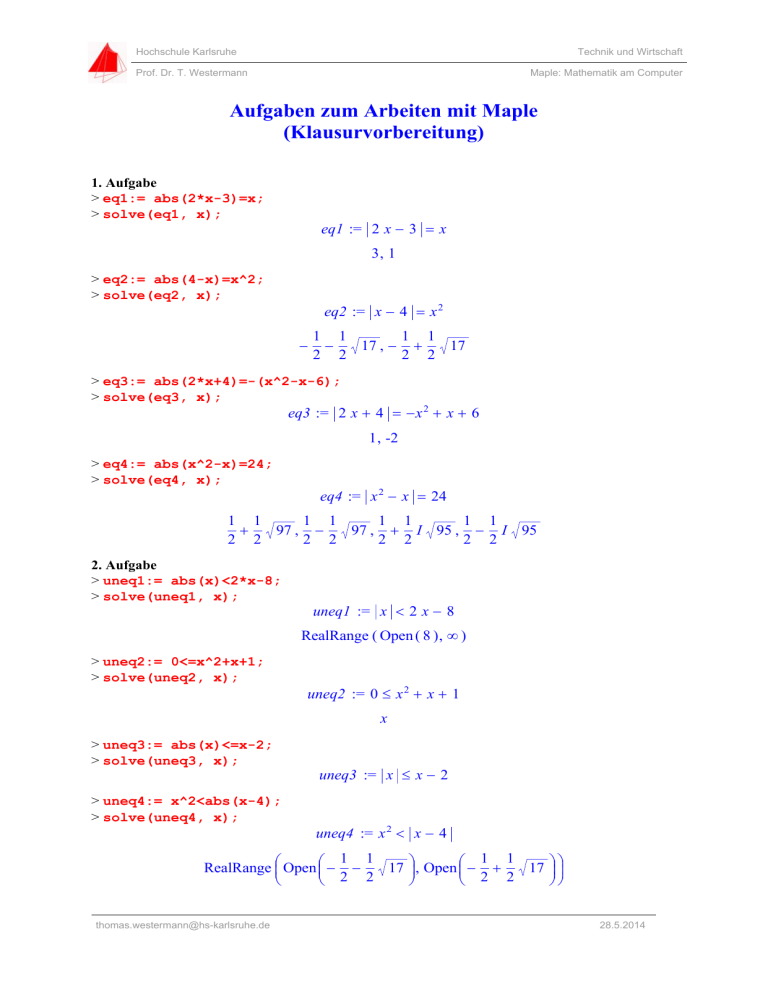
Hochschule Karlsruhe Technik und Wirtschaft Prof. Dr. T. Westermann Maple: Mathematik am Computer Aufgaben zum Arbeiten mit Maple (Klausurvorbereitung) 1. Aufgabe > eq1:= abs(2*x-3)=x; > solve(eq1, x); eq1 := 2 x 3 x 3, 1 > eq2:= abs(4-x)=x^2; > solve(eq2, x); eq2 := x 4 x 2 1 1 1 1 17 , 17 2 2 2 2 > eq3:= abs(2*x+4)=-(x^2-x-6); > solve(eq3, x); eq3 := 2 x 4 x 2 x 6 1 , -2 > eq4:= abs(x^2-x)=24; > solve(eq4, x); eq4 := x 2 x 24 1 1 1 1 1 1 1 1 97 , 97 , I 95 , I 95 2 2 2 2 2 2 2 2 2. Aufgabe > uneq1:= abs(x)<2*x-8; > solve(uneq1, x); uneq1 := x 2 x 8 RealRange ( Open ( 8 ) , ) > uneq2:= 0<=x^2+x+1; > solve(uneq2, x); uneq2 := 0 x 2 x 1 x > uneq3:= abs(x)<=x-2; > solve(uneq3, x); > uneq4:= x^2<abs(x-4); > solve(uneq4, x); uneq3 := x x 2 uneq4 := x 2 x 4 1 1 1 1 17 , Open 17 RealRange Open 2 2 2 2 [email protected] 28.5.2014 Hochschule Karlsruhe Technik und Wirtschaft Prof. Dr. T. Westermann Maple: Mathematik am Computer 3. Aufgabe > F:=<1,-1,2>: r:=<2,1,1>: > with(LinearAlgebra): > VectorAngle(F,r); 1 3 > M:=CrossProduct(r,F); 3 M := -3 -3 > Norm(M,2); 3 3 4. Aufgabe > M:=Matrix([ [a[1,1],a[1,2],a[1,3]], [a[2,1],a[2,2],a[2,3]], [a[3,1],a[3,2],a[3,3]] ]); a 1 , 1 M := a 2 , 1 a 3 , 1 a1, 2 a2, 2 a3, 2 a1, 3 a 2 , 3 a3, 3 eq1:=a[1,1]+a[1,2]+a[1,3]=s; eq2:=a[2,1]+a[2,2]+a[2,3]=s; eq3:=a[3,1]+a[3,2]+a[3,3]=s; eq4:=a[1,1]+a[2,1]+a[3,1]=s; eq5:=a[1,2]+a[2,2]+a[3,2]=s; eq6:=a[1,3]+a[2,3]+a[3,3]=s; eq7:=a[1,1]+a[2,2]+a[3,3]=s; eq8:=a[3,1]+a[2,2]+a[1,3]=s; sol:=solve({eq1,eq2,eq3,eq4,eq5,eq6,eq7,eq8}, {a[1,1],a[1,2],a[1,3],a[2,1],a[2,2],a[2,3],a[3,1],a[3,2],a[3,3]}); assign(sol); > M; 2 s a 3 , 3 3 2 s a 3 , 2 2 a 3 , 3 3 a 3 , 2 a 3 , 3 s 2 s a 3 , 2 3 1 s 3 a3, 2 1 a 3 , 2 a 3 , 3 s 3 4 a 3 , 2 2 a 3 , 3 s 3 a3, 3 > s:=3; a[3,3]:=2;a[3,2]:=1; > eval(M); 0 3 0 [email protected] 1 1 1 2 -1 2 28.5.2014 Hochschule Karlsruhe Technik und Wirtschaft Prof. Dr. T. Westermann Maple: Mathematik am Computer 5. Aufgabe > restart: > eq:= ln(sqrt(x)) +1.5*ln(x) = ln(2*x); > solve(eq,x); 2. 6. Aufgabe > f:= (x-1)*exp(x)-sin(x); > plot(f, x=-10..3); Abgelesen etwa: -9.4; -6.3; -2.9; -0.9; 1.3 > fsolve(f, x, -10..-8); -9.423936046 usw. 7. Aufgabe > plot(x+arccos(x), x=-1.2..1.2); Der Definitionsbereich ist zwischen -1 .. 1 Der Wertebereich ist zwischen 1 .. 1.2 8. Aufgabe > with(plots): > logplot(3*exp(4*x), x=0..10); 9. Aufgabe > an:= (3*n^2+4*n)/(surd(n^6+n^4+1,3)); 3 n 2 4 n an := surd ( n 6 n 4 1 , 3 ) > Limit(an, n=infinity)=limit(an, n=infinity); lim n [email protected] 3 n 2 4 n 3 surd ( n 6 n 4 1 , 3 ) 28.5.2014 Hochschule Karlsruhe Technik und Wirtschaft Prof. Dr. T. Westermann Maple: Mathematik am Computer 10. Aufgabe > x(t):= x0*exp(-g*t)*cos(w*t); x( t ) := x0 e > v(t):= diff(x(t),t); v( t ) := x0 g e ( g t ) > a(t):= diff(x(t), t$2); a( t ) := x0 g 2 e ( g t ) cos ( w t ) 2 x0 g e ( g t ) cos ( w t ) cos ( w t ) x0 e ( g t ) ( g t ) sin( w t ) w sin( w t ) w x0 e ( g t ) cos ( w t ) w 2 12. Aufgabe > with(LinearAlgebra): > a:=<3,4,3>; b:=<5,-1,0>; > sp:= DotProduct(a,b); sp := 11 > c:=CrossProduct(a, b); 3 c := 15 -23 > DotProduct(a, c); 0 > DotProduct(b, c); 0 13. Aufgabe > restart: > with(LinearAlgebra): > a:=<3,4,3>: b:=<5,-1,0>: c:=<-2,2,-3>: > M:= Matrix([a,b,c]); 3 5 -2 M := 4 -1 2 3 0 -3 > Determinant(M); 93 > d:=<1,-11,-3>: > LinearSolve(M,d); -2 1 -1 > -2*a+1*b-1*c; 1 -11 -3 [email protected] 28.5.2014 Hochschule Karlsruhe Technik und Wirtschaft Prof. Dr. T. Westermann Maple: Mathematik am Computer 14. Aufgabe > A:=Matrix([[3,5,-2],[4,-1,2],[3,0,-3]]); > MatrixInverse(A); 1 31 6 31 1 31 5 31 -1 31 5 31 8 93 -14 93 -23 93 15. Aufgabe > fsolve(z^6-2*z^5-8*z^4+24*z^3-z^2-30*z=0, z, complex); -3. , -1. , 0. , 2.000000000 1.000000000 I , 2. , 2.000000000 1.000000000 I 18. Aufgabe > deq:= diff(y(x),x)+4*y(x)=sin(x); > dsolve(deq, y(x)); y( x ) 1 4 ( 4 x ) _C1 cos ( x ) sin( x ) e 17 17 > deq:= diff(y(x),x$2)+4*diff(y(x),x)+4*y(x)=exp(-2*x); > dsolve(deq, y(x)); 1 ( 2 x ) ( 2 x ) ( 2 x ) y( x ) x 2 e _C1 e _C2 e x 2 19. Aufgabe > restart: > deq:= diff(x(t),t$2)+4*x(t)=0; 2 deq := 2 x( t ) 4 x( t ) 0 t > init:= x(0)=2, D(x)(0)=1; init := x( 0 ) 2 , D ( x ) ( 0 ) 1 > dsolve({deq,init}, x(t)); 1 x( t ) sin( 2 t ) 2 cos ( 2 t ) 2 > plot(rhs(%), t=0..4*Pi); [email protected] 28.5.2014