Treibhausgase_2.doc Relative Treibhauspotentiale (CO2 = 1)
Werbung
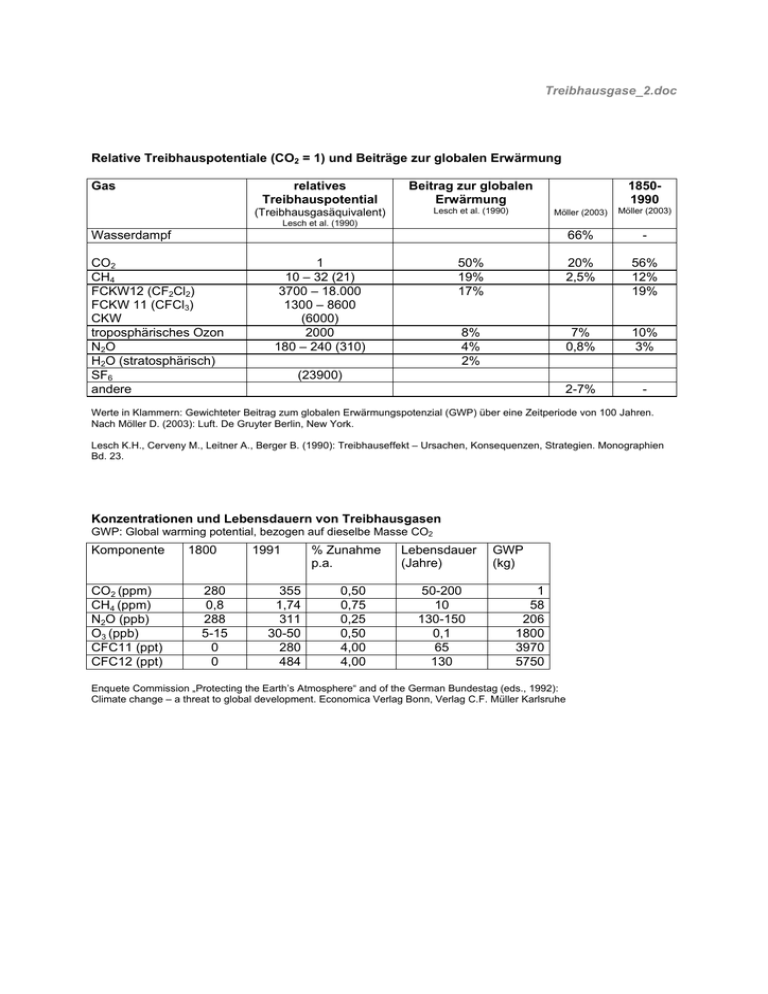
Treibhausgase_2.doc Relative Treibhauspotentiale (CO2 = 1) und Beiträge zur globalen Erwärmung Gas relatives Treibhauspotential Beitrag zur globalen Erwärmung (Treibhausgasäquivalent) Lesch et al. (1990) 18501990 Möller (2003) Möller (2003) 66% - 50% 19% 17% 20% 2,5% 56% 12% 19% 8% 4% 2% 7% 0,8% 10% 3% 2-7% - Lesch et al. (1990) Wasserdampf CO2 CH4 FCKW12 (CF2Cl2) FCKW 11 (CFCl3) CKW troposphärisches Ozon N2O H2O (stratosphärisch) SF6 andere 1 10 – 32 (21) 3700 – 18.000 1300 – 8600 (6000) 2000 180 – 240 (310) (23900) Werte in Klammern: Gewichteter Beitrag zum globalen Erwärmungspotenzial (GWP) über eine Zeitperiode von 100 Jahren. Nach Möller D. (2003): Luft. De Gruyter Berlin, New York. Lesch K.H., Cerveny M., Leitner A., Berger B. (1990): Treibhauseffekt – Ursachen, Konsequenzen, Strategien. Monographien Bd. 23. Konzentrationen und Lebensdauern von Treibhausgasen GWP: Global warming potential, bezogen auf dieselbe Masse CO2 Komponente CO2 (ppm) CH4 (ppm) N2O (ppb) O3 (ppb) CFC11 (ppt) CFC12 (ppt) 1800 280 0,8 288 5-15 0 0 1991 355 1,74 311 30-50 280 484 % Zunahme p.a. 0,50 0,75 0,25 0,50 4,00 4,00 Lebensdauer (Jahre) 50-200 10 130-150 0,1 65 130 GWP (kg) 1 58 206 1800 3970 5750 Enquete Commission „Protecting the Earth’s Atmosphere“ and of the German Bundestag (eds., 1992): Climate change – a threat to global development. Economica Verlag Bonn, Verlag C.F. Müller Karlsruhe Beitrag einzelner Aktivitäten zum globalen Treibhauseffekt Energie, Transport Chemische Produkte Tropische Entwaldung Landwirtschaft u.a. Emissionsquellen 50 % 20 % 15 % 15 % Enquete Commission „Protecting the Earth’s Atmosphere“ and of the German Bundestag (eds., 1992): Climate change – a threat to global development. Economica Verlag Bonn, Verlag C.F. Müller Karlsruhe Historische Entwicklung der Konzentrationen von Treibhausgasen Jahr 1850 1900 1960 1990 1995 ppm CO2 287 296 316 354 360 ppb CH4 750 970 1270 1720 1730 ppb N2O 260 292 296 310 312 Lelieveld J., Crutzen P.J., Dentener F.J. (1998): Changing concentration, lifetime and climate forcing of atmospheric methane. Tellus 50B, 128-150. Einige Voraussagen zum globalen Anstieg der Temperatur auf eine Verdopplung der CO2Konzentration. Temperaturanstieg (°C) 0,5 – 1,2 Quelle (zitiert in Krupa 1997) Lindzen (1982) Ramanathan (1981) IPCC (1990) 1,0 - 5,0 National Academy of Sciences (1992) 1,4 - 3,0 Schlesinger et al. (1992) 1,5 - 4,5 (best estimate 2,5) IPCC (1992a,b) 1,0 - 3,5 IPCC (1995) 2,0 - 4,0 Hansen (1991) Hansen (1993) Krupa S.V. (1997): Air Pollution People, and Plants. University of Minnesota St. Paul, S. 71. Summary of atmospheric processes and products relevant to global climate change Process Products Loss of stratospheric O3 Increased UV-B penetration Changes in temperature, precipition, CH4, CFCs, organo-bromines, N2O, COS, SO2?, radiation, evaporation, wind and secundary aerosols NOx and (NO+NO2), and changes in the Increases in greenhouses gases: CO2,O3, CO, concentration of H2O molecules Increased UV-B penetration Decreased O3 Krupa S.V. (1997): Air Pollution People, and Plants. University of Minnesota St. Paul, S. 71.
