London Smog
Werbung
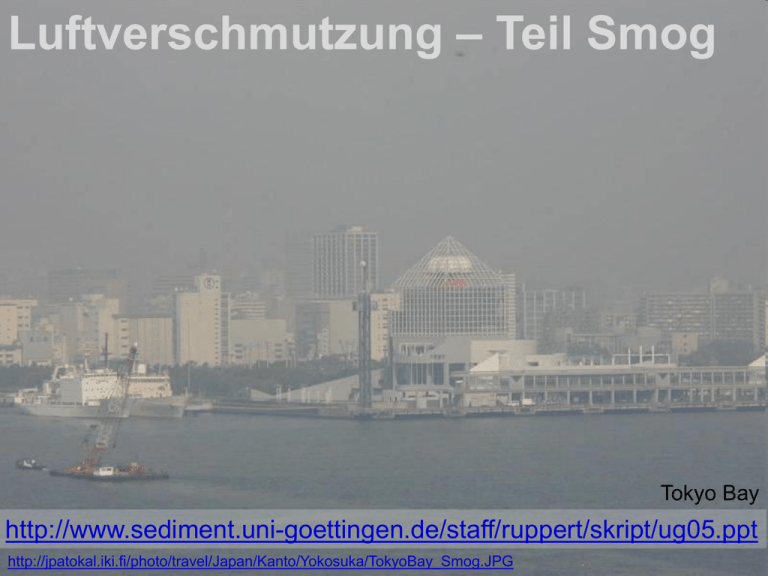
Luftverschmutzung – Teil Smog Tokyo Bay http://www.sediment.uni-goettingen.de/staff/ruppert/skript/ug05.ppt http://jpatokal.iki.fi/photo/travel/Japan/Kanto/Yokosuka/TokyoBay_Smog.JPG Substanzklassen, welche die Luft verunreinigen können, sind z.B.: - Gase: vor allem Schwefeldioxid (SO2), Kohlendioxid (CO2), Kohlenmonoxid (CO) und Stickoxide (NOx) - Staub: bestehend aus festen Partikeln mit einem Durchmesser von bis zu 100 µm - Aerosole: bestehend aus feinen Tröpfchen oder sehr kleinen festen Partikeln oder beiden, die in der Luft schweben; Durchmesser von Nanometers von bis zu 1 µm. Primäre und sekundäre Verunreinigungen - Primäre Verunreinigungen bestehen aus schädigenden Substanzen, die direkt in die Atmosphäre durch Emissionen eingebracht werden. - Sekundäre Verunreinigungen bestehen aus Substanzen, die ihre schädigende Wirkung erst nach dem Einbringen in die Luft oder durch chemische Bildung aus Vorläufern in der Luft entfalten. http://www.atmosphere.mpg.de/enid/1do.html (2006) http://www.atmosphere.mpg.de/enid/1do.html (2006) liegt dann vor, wenn schädigende Substanzen (feste Partikel, Gase oder Flüssigkeitströpfchen) in solcher Menge in der Luft enthalten sind, dass sie die Zusammensetzung der Luft maßgeblich verändern. Diese Veränderungen können einen negativen Einfluss auf die menschliche Gesundheit, Lebewesen, das Klima, Boden oder Wasser haben. Emission = Eintrag einer Verschmutzung in die Luft aus einer oder vielen Quellen. Natürliche Emissionen: Rauch aus dem Vulkan Sakura-jima, Japan Anthropogene Emissionen http://espere.mpch-mainz.mpg.de/documents/pdf/urbanclimate.pdf (3/2010) Luftverschmutzung Engelbrecht & Derbyshire (2010): Airborne Mineral Dust. Elements 6, 241–246. (after Prospero et al. 2002) Global distribution of dust sources. The Absorbing Aerosol Index (AAI) indicates the presence of elevated absorbing aerosols in the Earth's atmosphere (mostly desert dust and biomass burning aerosols). The number of days exceeding the AAI is shown in shades of yellow and brown. Arrows indicate the general direction of dust storms, and major impacted areas over the ocean are shown in paler shades of blue. Typical pollutants enriched in tropospheric air in areas with high population and industries • sulphur dioxide SO2 and nitrogen oxides NOx (mostly NO + NO2) (most of it from high temperature processes by burning fossil fuels) • reactive hydrocarbons (most of it from refineries, traffic, wood burning) • carbon dioxide CO2 und carbon monoxide CO (mostly of fossil fuel burning), methane (mostly of agriculture, fossil fuel extraction) • heavy metals (traffic and industry) • organic substances (solvents from chemical industry; aerosols and gases from burning waste and wood) • dust and soot Their concentrations in air depend strongly on the kind of industry and heating facilities, car density, measures against pollution etc. Historie von Luftbelastungen an einigen Beispielen In den Frühzeiten der menschlichen Zivilisation war lediglich der Rauch von Feuerplätzen eine Quelle menschlicher Luftverunreinigung. Die Emissionen pro Kopf waren sehr gering, die Weltbevölkerung ebenfalls. • Bei den Griechen wurden stärkere Emissionsquellen aus den Städten verbannt. • Horaz beschrieb die Wirkung der Holzfeuer auf die Hauswände des Alten Roms. • Aus dem Alten Rom wird von schweren Himmel berichtet, wenn bei einer Inversionswetterlage (Stagnation) die Luftverschmutzung zu stark wurde. • 1306 verbot König Edward I die Nutzung von Kohle in London. • 1661 schrieb John Evelyn (Bild) sein „Fumifugium – The Inconvinience of the Air and the Smoake of London Dissipated“. Er griff darin die „Brewers, Diers, Limeburners, Salt and Soup boylers“ an. „Smoke was responsible for the fouling of churches, palaces, clothes, furnishings, paintings, rain, dew, water and plants“. • Insbesondere die schnelle Entwicklung der Industrie im 19. und 20. Jahrhundert wurde zum Ursprung zahlreicher Verschmutzungsquellen. Eine ihrer wichtigsten Antriebsquellen war der aus Kohleverbrennung gedeckte wachsende Energiebedarf. In der Folge intensivierte sich die Verschmutzung durch den Ausbau von Heizsystemen in den Haushalten, die Entwicklung von Kraftwerken. • Seit 1950 avancierte der Kfz-Verkehr zu einem bedeutenden Umweltproblem. http://www.atmosphere.mpg.de/enid/1do.html (2013) etc. Liste von lokalen Katastrophen mit schweren Umweltbelastungen: - 1930 - Smog im Mosa Tal (Belgien), hohe Luftverschmutzung vor allem durch Schwefeldioxid führt zum Tod einigen hundert Menschen - 1948 - Donora (USA), ein Smog-Ereignis tötet 20 Personen - 1950 - Pozza Rica (Mexico), unkontrollierte Emissionen von Schwefelwasserstoff während einer Kraftwerksstörung; Vergiftung von 300 Personen, 22 sterben. - 1952 - Smog in London - etwa 4000 Menschen sterben - 1976 - Im italienischen Seveso kommt es nach einem Druckanstieg in einem Reaktor zur Herstellung von chlororganischen Chemikalien zur Freisetzung mit Dioxin belasteter Aerosole. Über 700 Menschen wurden evakuiert, die Langzeitauswirkungen sind nicht genau abschätzbar. - 1984 - Chemiekatastrophe in Bhopal (Indien) - 3400 Tote, ca. 600.000 Vergiftungsfälle bei der Explosion eines defekten Tankbehälters mit Methylisocyanat. - 1986 - Im Kernreaktor von Tschernobyl (Ukraine, früher UdSSR) kam es nach einer Überhitzung der Brennelemente zur Explosion des Reaktors und zur Kernschmelze. Radioaktive Spaltprodukte wurden freigesetzt und zogen in einer Wolke über Europa. 31 Personen starben in der ersten Woche nach der Explosion, über 100.000 wurden nach dem Unfall bzw. bei der Verschalung des Unfallreaktors sehr hohen Strahlendosen ausgesetzt. Erhöhte Krebsraten bei einigen Millionen Menschen. - 1991-92 Großbrände an Ölquellen während des ersten Irak-Krieges etc. http://www.atmosphere.mpg.de/enid/7ad5a59f86a7b2e0647c34bc14bfe179,55a304092d09/1dp.html (2013) Die Partikelkonzentration ist sehr niedrig: die Sichtweite beträgt etwa 250 km. Quelle: Glacier National Park (Canada) Hier beträgt die Sichtweite unter 70 km, da die Luft verschmutzt ist. Partikel und Sichtweite Unter der Sichtweite verstehen wir die größte Distanz, über die ein Beobachter ein großes schwarzes Objekt am Horizont noch gegen den Himmel sehen kann. Gasmoleküle und kleine atmosphärische Partikel sind kleiner als die Wellenlänge des sichtbaren Lichtes. Wenn das Licht auf ein Gasmolekül oder Feinstpartikel trifft, wird das Licht gestreut oder in verschiedene Richtungen reemittiert (Lichtstreuung). → Mit zunehmender Verschmutzung vermindert sich die Sichtweite durch Lichtstreuung (bei sonst gleichen Faktoren). http://www.atmosphere.mpg.de/enid/7ad5a59f86a7b2e0647c34bc14bfe179,55a304092d09/3bm.html (2006) European Environment Agency EEA (Nov. 2015): Many Europeans still exposed to harmful air pollution I Air pollution is the single largest environmental health risk in Europe. It shortens people’s lifespan and contributes to serious illnesses such as heart disease, respiratory problems and cancer. The most problematic pollutants affecting human health are • particulate matter (PM), • ground-level ozone (O3) and • nitrogen dioxide (NO2). Health impact estimates associated with long-term exposure show that • PM2.5 (particulate matter with diameter of < 2.5 µm) was responsible for 432 000 premature deaths in Europe in 2012. • NO2 was responsible for ~75 000 premature deaths. • O3 exposure caused 17 000 premature deaths. Alongside health, air pollutants also have a significant harmful impact on plant life and ecosystems including • eutrophication caused by ammonia (NH3) and nitrogen oxides (NOx) • damage to plants caused by O3. http://www.eea.europa.eu/media/newsreleases/many-europeans-still-exposed-to-air-pollution-2015 (8.12.2015) Percentage of the urban population in the EU-28 exposed to air pollutant concentrations above certain EU and WHO reference concentrations (2011–2013) The reference concentrations in brackets are in μg/m3 except for BaP (Benzo[a]pyren, polycyclic aromatic hydrocarbon) in ng/m3. WHO AQG = World Health Organisation Air Quality Guidelines The WHO guideline values are smaller than the EU reference values (except for NO2). For that reason, the exposure estimate following the WHO values is much higher. http://www.eea.europa.eu//publications/air-quality-in-europe-2015 (7.12.2015) http://whqlibdoc.who.int/hq/2006/WHO_SDE_PHE_OEH_06.02_eng.pdf?ua=1 (8.12.2015) European Environment Agency EEA (Nov. 2015): Many Europeans still exposed to harmful air pollution II Particulate Matter (PM): In 2013, 9% of the urban population in the EU were exposed to PM2.5 above the EU target value set to protect human health. 87% were exposed to PM2.5 concentrations that exceeded the more strict WHO value. Meeting the WHO air quality standard throughout the EU-28 would lead to average PM2.5 concentrations dropping by about one-third, resulting in 144 000 fewer premature deaths. O3 exposure remains very high. 15% of the EU-28 urban population were exposed to concentrations above the EU target value in 2013. 98% were exposed to O3 concentrations above the more strict WHO guideline value. The long-term objective for the protection of vegetation was exceeded in 86% of the total EU-28 agricultural area. NO2 affects the respiratory system directly, but also contributes to the formation of PM and O3. In 2013, 9% of the urban population in the EU-28 were exposed to NO2 concentrations above the WHO and identical EU standards. SO2 emissions have been reduced significantly over past decades as a result of EU legislation requiring the use of emissions scrubbing technology and lower S content in fuels. There were only a few exposition exceedances of the SO2 EU limit in 2013, but 37 % of the urban population were exposed to values above the SO2 WHO standard. Benzo(a)pyrene (BaP) is an organic pollutant that is carcinogenic. Typically formed as a result of wood burning, exposure to BaP pollution is widespread. A quarter of the EU-28 urban population were exposed to BaP concentrations above the EU target value in 2013. 91% were exposed to BaP concentrations above the lower WHO reference level. Carbon monoxide, benzene and heavy metal concentrations in outdoor air were generally low in the EU in 2013, with few exceedances. Air pollutants can have a serious impact on human health. Children and the elderly are especially vulnerable. http://www.eea.europa.eu/signals/sig nals-2013/infographics/healthimpacts-of-air-pollution/view (7.12.2015) Diseases by the joint effects of household and ambient air pollution on a global basis in 2012 = CoronarArterienKrankheit 7 Million deaths by indoor and outdoor air pollution = chronic obstructive pulmonary disease Worldwide, indoor and outdoor air pollution are jointly responsible for ~7 million premature deaths annually, the vast majority occurring in low- and middle-income countries. Worldwide, 3.7 million premature deaths were attributable to outdoor pollution in 2012. ~88% of these deaths occurred in low- and middle-income countries, which represent 82% of the world population. South-East Asia Region 936 000 deaths, Western Pacific Region: 1.74 million deaths by outdoor air pollution. WHO (2015): Health in 2015: from MDGs, Millennium Development Goals to SDGs, Sustainable Development Goals. p. 143. http://apps.who.int/iris/bitstream/10665/200009/1/9789241565110_eng.pdf?ua=1 (8.12.2015) Smog: Das Wort 'Smog' setzt sich zusammen aus den englischen Worten für Rauch (smoke) und Nebel (fog)(Harold Des Voeux, 1911). Es gibt zwei Arten von Smog: London Smog = winter smog photochemical smog = Los Angeles smog = summer smog Buildings are blanketed in heavy smog in Beijing (China), Jan. 16, 2014. Photochemical Smog over Sao Paulo (Brazil). http://world.time.com/2014/01/16/winter-smog-shroudsbeijing/ (10.12.2015) http://www.brighthub.com/environment/scienceenvironmental/articles/121244.aspx (10.12.2015) London Smog: London Smog war primär geprägt durch die aus der Kohleverbrennung stammende Mischung aus Schwefeldioxid (SO2) und Staub. Durch eine Vermengung mit Nebel (fog) bilden sich in der Luft schwebende Tröpfchen von Schwefelsäure (H2SO4). 1952 wurde in London bei einer extremen Smogperiode eine SO2-Konzentration von 3600 µg/m3 Luft erreicht mit einer massiven Häufung von Todesfällen. LondonSmog ist heute selten. Im Jahr 2001 betrugen die jährlichen SO2-Mittelwerte in Städten in µg/m3 (maximale Stundenwerte dahinter): Barcelona 3 (70) München 4 (17) London 7 (106) Warschau 13 (211) Beijing 1995: 140, 2006: 45 Claude Monet (1904): Das Parlament in London (im Smog) (Musée d´Orsay, Paris) TA-Luft Normen für SO2 Jahresmittel des 30-Minutenwerts: 140 µg/m3 120 ppb 98%-Wert der 30-Minutenwerte: 400 µg/m3 330 ppb Tod durch Smog in London: Zahl der Toten im Dez. 1952 als Folge extrem hoher SO2-Gehalte http://www.atmosphere.mpg.de/enid/1do.html (2013) Wintersmog (kein Smog) Im Winter kann eine teilweise unvollständige Verbrennung zur Anreicherung von Partikeln (particulate matter, PM), flüchtigen organischen Stoffen ohne Methan (Non-Methane Volatile Organic Compounds, NMVOC), Kohlenmonoxid (CO) und Stickoxiden (NOx) und SO2 in der Atmosphäre führen. Wenn eine sog. Inversions-wetterlage eintritt (bei geringer Luftbewegung; häufig bei speziellen morphologischen Situationen wie Tal- oder Beckenlagen), können sich diese Stoffe in der unteren, kühleren stabilen Schicht anreichern. http://www.ec.gc.ca/cleanairairpur/Winter_Smog-WSAFF4D58F-1_En.htm (2013) Photochemical Smog = Summer Smog = Los Angeles Smog Normal vertical temperature distribution (warm ground layer with height it is getting cooler) Temperature inversion (cool ground layer, covered by a warm air layer). Emissions stagnate in the cold ground layer. Smog in Pasadena (N of Los Angeles) Chiras (1988) Photochemischer Smog = Sommersmog = Los Angeles Smog - Generelles Bildung: Beim photochemischen Smog handelt es sich um ein Schadstoffgemisch, das in der unteren Atmosphäre aus einer Vielzahl von Vorläufersubstanzen an sonnigen Tagen entsteht: Bei intensiver Sonneneinstrahlung werden durch komplexe photochemische Reaktionen vor allem aus den Vorläufersubstanzen Stickstoffoxide (NOx) und flüchtigen organischen Verbindungen ohne Methan (NMVOC), aber auch CO und CH4 so genannte photo-chemische Oxidantien (Photooxidantien) wie Ozon O3, aber auch Stickstoffdioxid (NO2), organische Nitrate wie Peroxyacetylnitrat (PAN= CH3COONO3), Wasserstoffperoxid (H2O2), Aldehyde und organische Säuren gebildet. O3 entsteht also indirekt. Es ist dennoch die Leitsubstanz des Sommersmogs, da es von der Konzentration und den Wirkungen her dominiert. O3 ist in Bodennähe unerwünscht und tritt für gewöhnlich in Gehalten um 0,04 ppm auf (in der Stratosphäre bis 12 ppm). Auswirkungen: Die Gase im Sommersmog reizen die Augen und schädigen die Atemwege. Sie haben negative Auswirkungen auf Pflanzen. Verbreitung: Sommersmog ist heute im Sommer sehr verbreitet. Im extrem heißen August des Jahres 2003 wurden in Mannheim 320 µg/m3 Luft gemessen. Typische Werte liegen unter 100 µg/m3, Warnschwellen und EU-Grenzwerte liegen bei 180 und 240, bald bei 120 µg/m3. Umweltbundesamt (2004) Air conditions in Beijing in August 2005. The photograph was taken after it had rained for two days. The photograph shows smog covering Beijing in what would otherwise be a sunny day. https://commons.wikimedia.org/wiki/File:Beijing_smog_comparison_August_2005.png (12.11.2015) Visible pollutants react with sunlight to create invisible ozone pollution, which frequently reaches unhealthy levels in cities like Los Angeles. Highland Park Optimist Club wearing smog gas masks at banquet, Los Angeles, ca. 1954 http://en.wikipedia.org/wiki/Smog (6.1.2016) Americans face the risk of a 70 percent increase in unhealthy summertime ozone levels by 2050. This is because warmer temperatures and other changes in the atmosphere related to a changing climate, including higher atmospheric levels of methane, spur chemical reactions that lead to ozone. http://www.sciencedaily.com/releases/2014/05/140505130528.htm (14.5.2014) nach Pfister et al. (2014): Projections of Future Summertime Ozone over the U.S.. Journal of Geophysical Research: Atmospheres 119, 24 S. The compounds in the ozone game Ozone is not directly emitted but formed from the photochemical oxidation of reactive hydrocarbons (RH) in the presence of nitrogen oxides (NOx): RH + NOx + sunlight → O3 + oxidized HC (simplified) = Peroxacetylnitrat = CH3COONO3 R.P. Turco (1997): Earth under Siege. S. 143 Bildung von Ozon im Laufe des Tages R.P. Turco (1997): Earth under Siege. S. 157 Reaktionen bei der Bildung des photochemischen Smogs (stark vereinfacht): zunächst Hochtemperaturprozesse (Autoabgase, sonstige Verbrennung): Hitze N 2 + O2 2 NO In Anwesenheit von NO, reaktiven Kohlenwasserstoffen, OH-Radikalen (als Initiator) und Sonnenlicht können vereinfacht folgende Reaktionen ablaufen: OH + RH R• + H2O RH = „reactive hydrocarbon“ variabler Zusammensetzung, gehören zu den „volatile organic carbons“ (VOC) R• + O2 + M RO2• + M RO2• = Peroxyradikal RO2• + NO RO• + NO2 M = inertes Molekül, das überschüssige NO2 + hν NO + O Energien aufnimmt (Katalysator) O + O2 + M O3 + M stark vereinfacht: hν + O2 RH + OH + NO O3 + NO2 + HC Die Ausgangs-Ingredienzien des Smog (NOx und RH) können beide aus Autoabgasen stammen. Die NO2-Photolyse ist der „Motor“ der Ozonbildung, und flüchtige organische Verbindungen sind der „Treibstoff“, der dafür sorgt, dass NO immer wieder schnell zu NO2 umgewandelt wird. (stark vereinfacht nach Turco, 1997) Emissions of ozone precursors, EU15 The targets for 2010 are the Gothenburg Protocol target (December 1999) and the more recent National Emission Ceilings Directive (NECD) Common Position targets (June 2000) for non-methane volatile organic compounds and nitrogen oxides. http://www.eea.europa.eu/data-and-maps/figures/emissions-of-ozone-precursors-eu15-1 (13.12.2011) Die Europäische Umweltagentur (EUA) kombiniert die Emissionen von NOx, NMVOC (non-methane volatile organic carbons), CO und CH4 mit Hilfe von Gewichtungsfaktoren zu einer Gesamtzahl, die als NMVOC 1.00 Indikator für das Ozonbildungsvermögen dienen kann. Das OzonNOx 1.22 bildungspotential von NMVOC und NOx ist also etwa zehnmal so 0.11 groß wie das von CO und etwa 100-mal so groß wie das von Methan. CO CH4 0.014 Die Gewichtungsfaktoren betragen, normiert auf NMVOC: Emissions of ozone precursors (EEA member countries) http://www.eea.europa.eu/data-and-maps/figures/emissions-of-ozone-precursors-eea-member-countries-1 (7.12.2015) NOx: 11.960 kt Contribution of different sectors (energy and nonenergy) to total emissions of tropospheric ozone precursors (2008, EEA32) CO: 30.781 kt NMVOC: 9.848 kt CH4: 22.653 kt http://www.eea.europa.eu/data-and-maps/figures/contributionof-different-sectors-energy (3.12.2015) Mittlere monatliche Tagesgänge von Ozon für die Monate Januar bis Dezember von 1995 bis 2000 (Umweltbundesamt, 2001) Wenngleich OH das wichtigste Oxidationsmittel in der Atmosphäre ist, sind die Gehalte nachts nahezu null, da die Bildung Sonnenstrahlung erfordert. Nachts sinkt deswegen der O3-Gehalt, am Tag baut er sich nach Bildung der OH-Radikale wieder auf. Zahl der Tage mit Überschreitung des Ozon-Zielwertes (120 µg/m³) zum Schutz der menschlichen Gesundheit http://www.umweltbundesamt-daten-zur-umwelt.de/umweltdaten/public/theme.do?nodeIdent=3591 (13.12.2012) Trend in ozone annual mean values based on the average of measuring stations in the “rural background“, “urban background“ and “urban traffic“ in Germany between 1995 and 2014 Mean annual ozone concentration (µg/m3) rural background urban background urban traffic https://www.umweltbundesamt.de/daten/luftbelastung/ozon-belastung (7.12.2015) Summary: From the city to remote areas - The complete ozone oxidation cycle Citys: NO-rich air rises from cars and houses. This NO reacts with O3 already in the air to form NO2. So the first part of the reaction cycle actually causes a loss of O3. The plumes of NOx-rich air are then transported by the wind to the countryside. Over rural areas, downwind of cities, the ozone formation cycle starts: 1) NO2 is broken down by the Sun to form oxygen atoms (O) and nitrogen monoxide (NO). 2) The O atoms react O2 to form O3. 3) The NO reacts with peroxy radicals RO2 (from reaction of organic molecules of plants with OH radical and O2) forming NO2 again. 4) Some O3 is removed by reaction with NO. The amount lost depends on the concentration of the competing RO2 radicals. http://espere.mpch-mainz.mpg.de/documents/pdf/urbanclimate.pdf (3/2010) Beispiel einer Smog-Periode, gezeigt am Ozongehalt in der Luft Number of days on which the 2012 target value of 120 µg/m3 for the protection of human health was exceeded (average of summers of 2012, 2013 and 2014). The long-term objective (i.e. the maximum daily 8-hour mean concentration of ozone should not exceed 120 μg/m3) was exceeded in 81% of all reporting stations. http://www.eea.europa.eu/themes/air/ozone/airpollution-by-ozone-across (8.12.2015) Development of Emissions of NMVOC in Germany in 1000 tons Goal 2010: 995 http://iir-de.wikidot.com/emission-trends-non-methane-volatile-organic-compounds (7.11.2015) Emissions von nitrogen oxides (calculated as NO2) in Germany in 1000 t Goal 2010: 1051 http://iir-de.wikidot.com/emission-trends-nitrogen-oxide (7.11.2015) Entwicklung der NO2-Jahresmittelwerte in Deutschland im Mittel über alle Messstationen im jeweiligen Belastungsregime, Zeitraum 2000–2014. https://www.umweltbundesamt.de/sites/default/files/medien/378/publikationen/hintergrund_luftqualitaet_2014.pdf (12.3.2015) (Umweltbundesamt, 2011) Number of days with exceedings http://www.umweltbundesamt-daten-zurumwelt.de/umweltdaten/public/theme.do?nodeIdent=3591 (8.12.2015) Ozone values >180 µg/m³ in Germany 19902008 (Umweltbundesamt, 2011) http://www.umweltbundesamt-daten-zurumwelt.de/umweltdaten/public/theme.do?nodeIdent=3591 (10.12.2013) Average ozone values during the years 19902008 in Germany Anzahl Hitzetage (Tmax >30°C) und Überschreitungen des Zielwertes für Ozon in Stuttgart * Zahl der Tage mit Überschreitung des Ozon-Zielwertes (120 µg/m³) zum Schutz der menschlichen Gesundheit als 8-Std.-MW. https://www.umweltbundesamt.de/daten/umwelt-gesundheit/hitzetage-gesundheitliche-belastung-durch (25.11.2015) Chronic plant damage by ozone. These photographs show leaves from prunus serotina (the autumn cherry) 0%, 4.4%, 7.8%, 12.3% and 24.5% damage. http://espere.mpch-mainz.mpg.de/documents/pdf/loweratmosphere.pdf (3/2006) Effect of increasing ozone concentration on growth of Pima cotton (left to right: about 15, 80 and 150 ppb (O3) Danger to the respiratory system O3 is a reactive and irritant gas and, in high concentrations, leads to respiratory problems. It causes inflammation in the lungs and bronchia. People with respiratory problems such as asthma are particularly at risk of health problems. In the worst case, high ozone levels can cause death. Grantz & Shrestha (2005): California Agriculture 59(2):137-143; http://ucanr.edu/repositoryfiles/ca5902p137-69176.pdf (8.12.2015) Lungenbläschen (Alveolen) werden durch Ozon angegriffen. Ozon reagiert mit den Fettsäuren in den Lungen. Es lagert sich an die Doppelbindungen an, bricht sie und erzeugt hierdurch aggressive Radikale, die zu weiterer Oxidation führen. Die Konsequenz ist eine Entzündung der Lungen, die insbesondere für Menschen mit Asthma gefährlich, aber auch für Gesunde schädlich ist. Die Aufnahmefähigkeit der Lunge sinkt, und die Atmung wird flach. Man sollte keinen Sport treiben und harte körperliche Arbeit vermeiden, wenn die Ozon-Werte hoch sind. Ozon greift auch die Doppelbindungen von in der Natur freigesetzten Molekülen an, wie z.B. den Terpenen (Riechstoffe des Waldes) oder Bio-Molekülen an den Oberflächen von Pflanzen. Blätter erleiden durch Ozonanreicherungen Schäden. The reaction of ozone with double bonds (ozonolysis) breaks down (cracks) the C=C bond http://www.atmosphere.mpg.de/enid/7ad5a59f86a7 b2e0647c34bc14bfe179,55a304092d09/2s0.html Die neben O3 beiden wichtigsten atmosphärischen Oxidantien OH und NO3 haben eine extrem kurze Lebenszeit und reagieren sofort, wenn sie gebildet werden. O3 jedoch schafft es hinunter bis in unsere Lungen. Jeden Tag strömen 20 m3 Luft in die die kleinen Lungenbläschen, die eine Oberfläche von 80 100 m2 haben. O3 kann hier eindringen und reagieren. Pyramid of effects caused by ozone The relationship between the severity of the effect and the proportion of the population experiencing the effect can be presented as a pyramid. Many individuals experience the least serious, most common effects shown at the bottom of the pyramid. Fewer individuals experience the more severe effects such as hospitalization or death. Neue Ozonschwellenwerte (EU) für die menschliche Gesundheit Am 21. Mai 2008 wurde die Richtlinie 2008/50/EG verabschiedet, die Zielwerte, Langfristziele, eine Informationsschwelle und eine Alarmschwelle für bodennahes Ozon enthält. Die Mitgliedsstaaten der EU sind aufgefordert, durch geeignete Maßnahmen die Zielwerte einzuhalten. "Langfristziel" ist eine OzonKonzentration, unterhalb der direkte schädliche Auswirkungen auf die menschliche Gesundheit und/oder die Umwelt nach den derzeitigen wissenschaftlichen Erkenntnissen unwahrscheinlich sind. Dieses Ziel ist langfristig (Zeithorizont: 2020) zu erreichen. Für Ozon soll eine Informationsschwelle von 180 µg/m3 und eine Alarmschwelle von 240 µg/m3 gelten. Zum Schutz der menschlichen Gesundheit ist ein Zielwert festgelegt: Der maximale 8-Stunden-Wert eines Tages darf an höchstens 25 Tagen pro Kalenderjahr, gemittelt über 3 Jahre, den Wert von 120 µg/m3 überschreiten. Langfristig sollen die maximalen 8Stundenmittel den Wert von 120 µg/m3 gar nicht mehr überschreiten. Ozone 2012. 8 hour mean target value for the protection of human health In the air quality directive, the EU has set a target value and a long term objective value for O3 for the protection of human health. Target value: the maximum daily 8hour mean may not exceed 120 µg/m3 on more than 25 days per year averaged over three years. Long term objective value: the maximum daily 8-hour mean may not exceed 120 µg/m3 within a year. http://www.eea.europ a.eu/data-andmaps/figures/ozone8-hour-mean-targetvalue-for-theprotection-of-humanhealth (8.12.2015) Langfristig: nur an 1 Tag/Jahr Langfristig: 6000 µg/m3.h Umweltbundesamt (2003) Zielwerte Richtlinie 2002/3/EG, in deutsches Recht Sept. 2003: AOT40-Wert (accumulated exposure over a threshold of 40 ppb) = summierte Überschreitung aller Stundenmittelwertes über 40 ppb (Tageslicht, 8:00 Uhr bis 20:00 Uhr); Biomasseverlust: 5% Ozon und Pflanzen: • Ground-level ozone interferes with the ability of plants to produce and store food, which makes them more susceptible to disease, insects, other pollutants, and harsh weather. • Ozone damages the leaves of trees and other plants, ruining the appearance of cities, national parks, and recreation areas. • Ozone reduces crop and forest yields and increases plant vulnerability to disease, pests, and harsh weather. Grantz & Shrestha (2005): Ozone reduces crop yields and alters competition with weeds such as yellow nutsedge. California Agriculture 59(2):137-143. http://ucanr.edu/repositoryfiles/ca5902p137-69176.pdf (8.12.2015) Effect of ozone exposure and nutsedge competition on shoot biomass production of tomato and cotton grown alone or with nutsedge (Nuss- oder Zypergras) EU-28 emission trends for main air pollutants relative to 1990/2000 http://www.eea.europa.eu/soer-2015/europe/air#tab-based-on-indicators (7.11.2015) Exposure of agricultural area and exposure of forest area to O3 (AOT40 in (μg/m3)*hour) in the EEA-33 member countries between 2003/04 - 2012 Target: 18000, objective 6000 (µg/m3)*h Target: 10000 (µg/m3)*h Direct exposure to O3 is considered to be more damaging to vegetation than exposure to any other air pollutant. http://www.eea.europa.eu/publications/air-quality-in-europe-2015/at_download/file (2.12.2015) Rural concentration of the O3 indicator AOT40 for crops in 2012 Increase from northern Europe towards the Mediterranean countries. Target: 18000 (µg/m3)*h Objective: 6000 (µg/m3)*h http://www.eea.europa.eu/ publications/air-quality-ineurope2015/at_download/file (2.12.2015) Yield losses of wheat (left) and tomato (right) in % due to ozone pollution in 2000, based on modeling ozone uptake United Nations Economic Commission for Europe (2011): 30 years of effects research, monitoring and modelling under the Convention on Long-range Transboundary Air Pollution. http://www.unece.org/fileadmin/DAM/env/documents/2011/eb/wge/WEB_WGE-Broschure.pdf (8.12.2015) Rural concentration of the O3 indicator AOT40 for forests in 2012 Target: 10000 (µg/m3)*h http://www.eea.europa.eu/ publications/air-quality-ineurope2015/at_download/file (2.12.2015) http://www.atmosphere.mpg.de/enid/1do.html https://www.umweltbundesamt.de/sites/default/files/medien/376/publikationen/schwe rpunkte_2015_jahrespublikation_des_umweltbundesamtes.pdf (16.12.2015) Dieselautos sind die größte NO2Quelle in Deutschland How a catalytic converter in a car works A three-way catalytic converter has three simultaneous tasks: (1) 2 NOx → x O2 + N2 (2) 2CO + O2 → 2 CO2 (3) CxH2x+2 + [(3x+1)/2] O2 → x CO2 + (x+1) H2O λ = stoichiometric air/fuel ratio Keramikmonolith , belegt mit stoichiometric porösem point:. This is Al2O3, auf between 14.6 and 14.8 parts das Pt, air to 1 part fuel Pd oder Rh aufgefor gasoline tragen ist) conversion rate (%) http://www2.warwick.ac.uk/fac/sci/physi cs/research/condensedmatt/nmr/memb ers/postgraduates/greg/cat.jpg onversion rate (%) λ-window rich lean
