Turbitex IgM - Analyticon Diagnostics
Werbung
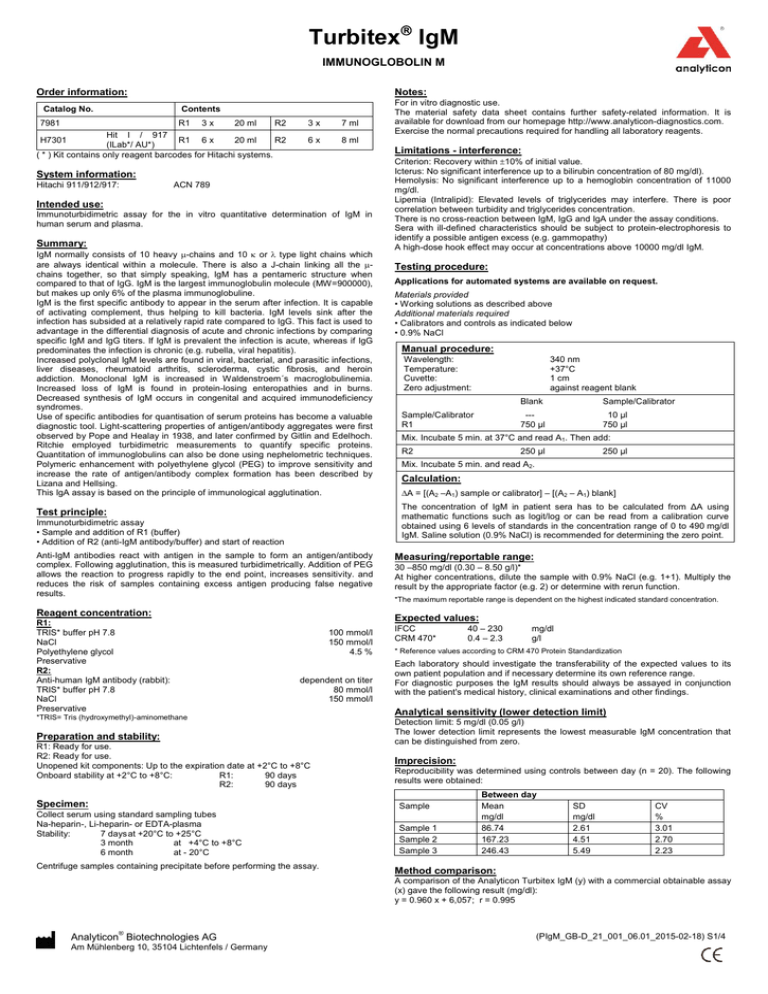
Turbitex IgM IMMUNOGLOBOLIN M Order information: Catalog No. Notes: Contents 7981 R1 3 x 20 ml R2 Hit I / 917 H7301 R1 6 x 20 ml R2 (ILab*/ AU*) ( * ) Kit contains only reagent barcodes for Hitachi systems. 3x 7 ml 6x 8 ml Limitations - interference: System information: Hitachi 911/912/917: ACN 789 Intended use: Immunoturbidimetric assay for the in vitro quantitative determination of IgM in human serum and plasma. Summary: IgM normally consists of 10 heavy -chains and 10 or type light chains which are always identical within a molecule. There is also a J-chain linking all the chains together, so that simply speaking, IgM has a pentameric structure when compared to that of IgG. IgM is the largest immunoglobulin molecule (MW=900000), but makes up only 6% of the plasma immunoglobuline. IgM is the first specific antibody to appear in the serum after infection. It is capable of activating complement, thus helping to kill bacteria. IgM levels sink after the infection has subsided at a relatively rapid rate compared to IgG. This fact is used to advantage in the differential diagnosis of acute and chronic infections by comparing specific IgM and IgG titers. If IgM is prevalent the infection is acute, whereas if IgG predominates the infection is chronic (e.g. rubella, viral hepatitis). Increased polyclonal IgM levels are found in viral, bacterial, and parasitic infections, liver diseases, rheumatoid arthritis, scleroderma, cystic fibrosis, and heroin addiction. Monoclonal IgM is increased in Waldenstroem´s macroglobulinemia. Increased loss of IgM is found in protein-losing enteropathies and in burns. Decreased synthesis of IgM occurs in congenital and acquired immunodeficiency syndromes. Use of specific antibodies for quantisation of serum proteins has become a valuable diagnostic tool. Light-scattering properties of antigen/antibody aggregates were first observed by Pope and Healay in 1938, and later confirmed by Gitlin and Edelhoch. Ritchie employed turbidimetric measurements to quantify specific proteins. Quantitation of immunoglobulins can also be done using nephelometric techniques. Polymeric enhancement with polyethylene glycol (PEG) to improve sensitivity and increase the rate of antigen/antibody complex formation has been described by Lizana and Hellsing. This IgA assay is based on the principle of immunological agglutination. Criterion: Recovery within 10% of initial value. Icterus: No significant interference up to a bilirubin concentration of 80 mg/dl). Hemolysis: No significant interference up to a hemoglobin concentration of 11000 mg/dl. Lipemia (Intralipid): Elevated levels of triglycerides may interfere. There is poor correlation between turbidity and triglycerides concentration. There is no cross-reaction between IgM, IgG and IgA under the assay conditions. Sera with ill-defined characteristics should be subject to protein-electrophoresis to identify a possible antigen excess (e.g. gammopathy) A high-dose hook effect may occur at concentrations above 10000 mg/dl IgM. Testing procedure: Applications for automated systems are available on request. Materials provided • Working solutions as described above Additional materials required • Calibrators and controls as indicated below • 0.9% NaCl Manual procedure: Wavelength: Temperature: Cuvette: Zero adjustment: 340 nm +37°C 1 cm against reagent blank Sample/Calibrator R1 Blank Sample/Calibrator --750 µl 10 µl 750 µl Mix. Incubate 5 min. at 37°C and read A1. Then add: R2 250 µl 250 µl Mix. Incubate 5 min. and read A2. Calculation: A = [(A2 –A1) sample or calibrator] – [(A2 – A1) blank] The concentration of IgM in patient sera has to be calculated from ΔA using mathematic functions such as logit/log or can be read from a calibration curve obtained using 6 levels of standards in the concentration range of 0 to 490 mg/dl IgM. Saline solution (0.9% NaCl) is recommended for determining the zero point. Test principle: Immunoturbidimetric assay • Sample and addition of R1 (buffer) • Addition of R2 (anti-IgM antibody/buffer) and start of reaction Anti-IgM antibodies react with antigen in the sample to form an antigen/antibody complex. Following agglutination, this is measured turbidimetrically. Addition of PEG allows the reaction to progress rapidly to the end point, increases sensitivity. and reduces the risk of samples containing excess antigen producing false negative results. Reagent concentration: R1: TRIS* buffer pH 7.8 NaCl Polyethylene glycol Preservative R2: Anti-human IgM antibody (rabbit): TRIS* buffer pH 7.8 NaCl Preservative For in vitro diagnostic use. The material safety data sheet contains further safety-related information. It is available for download from our homepage http://www.analyticon-diagnostics.com. Exercise the normal precautions required for handling all laboratory reagents. Measuring/reportable range: 30 –850 mg/dl (0.30 – 8.50 g/l)* At higher concentrations, dilute the sample with 0.9% NaCl (e.g. 1+1). Multiply the result by the appropriate factor (e.g. 2) or determine with rerun function. *The maximum reportable range is dependent on the highest indicated standard concentration. Expected values: 100 mmol/l 150 mmol/l 4.5 % dependent on titer 80 mmol/l 150 mmol/l *TRIS= Tris (hydroxymethyl)-aminomethane Preparation and stability: R1: Ready for use. R2: Ready for use. Unopened kit components: Up to the expiration date at +2°C to +8°C Onboard stability at +2°C to +8°C: R1: 90 days R2: 90 days IFCC CRM 470* mg/dl g/l * Reference values according to CRM 470 Protein Standardization Each laboratory should investigate the transferability of the expected values to its own patient population and if necessary determine its own reference range. For diagnostic purposes the IgM results should always be assayed in conjunction with the patient's medical history, clinical examinations and other findings. Analytical sensitivity (lower detection limit) Detection limit: 5 mg/dl (0.05 g/l) The lower detection limit represents the lowest measurable IgM concentration that can be distinguished from zero. Imprecision: Reproducibility was determined using controls between day (n = 20). The following results were obtained: Specimen: Sample Collect serum using standard sampling tubes Na-heparin-, Li-heparin- or EDTA-plasma Stability: 7 days at +20°C to +25°C 3 month at +4°C to +8°C 6 month at - 20°C Sample 1 Sample 2 Sample 3 Centrifuge samples containing precipitate before performing the assay. 40 – 230 0.4 – 2.3 Between day Mean mg/dl 86.74 167.23 246.43 SD mg/dl 2.61 4.51 5.49 CV % 3.01 2.70 2.23 Method comparison: A comparison of the Analyticon Turbitex IgM (y) with a commercial obtainable assay (x) gave the following result (mg/dl): y = 0.960 x + 6,057; r = 0.995 Analyticon® Biotechnologies AG Am Mühlenberg 10, 35104 Lichtenfels / Germany (PIgM_GB-D_21_001_06.01_2015-02-18) S1/4 Turbitex IgM IMMUNOGLOBOLIN M Quality control: Protein Control Level 1 Protein Control Level 2 3 x 1 ml 3 x 1 ml #7661 #7662 The control intervals and limits must be adapted to the individual laboratory and country-specific requirements. Values obtained should fall within established limits. Each laboratory should establish corrective measures to be taken if values fall outside the limits. Calibration: Standardization: The IgM method was calibrated against the CRM 470 reference material. S1: 0.9% NaCl S2-S6: Bio Cal® P 3 x 1 ml #1470 ® Bio Cal P Set 5 X 1 ml #1475 Calibration frequency Multicalibration Full recalibration is recommended • after lot change • as required following quality control procedures Literature: 1. 2. 3. 4. 5. 6. 7. 8. 9. 10. 11. 12. 13. 14. Consensus values of the „Deutsche Gesellschaft für Laboratoriumsmedizin“, the „Deutschen Gesellschaft für Klinische Chemie“ and the „Verband der Diagnostica-Industrie e.V. (VDGH)“. Clin Lab 1995;41:743-748 Deutsch E, Geyer G, Wenger R. Laboratoriumsmedizin. Normalbereich der Ergebnisse und Interpretation abnormer Befunde, 3rd ed. Basel/Munich: Karger 1992. Gitlin D, Edelhoch H. J Immunol 11951;66:76-78 Guder WG, Narayanan S, Wisser H, Zawta B. List of Analytes Preanalytical Variabled. Brochure in: Samples: From the Patient to the Laboratory. Darmstadt: GIT-Verlag, 1996 Heidelberger M, Kendall FE. J Exp Med 1935;62:697 Henry JB. Clinical Diagnosis and Management by Laboratory Methods, II. Philadelphia: WB Saunders Co 1979 Kaplan La. Pesce AJ, eds. Clinical Chemistry, Theory, Analysis and Correlation. St Louis: CV Mosby Co 1984 Killingsworth LM, Savory J. Clin Chem 1972;18:335 Lizana J Hellsing K. Clin Chem 1974;20:1181 Ritchie RF. J Lab Clin Med 1967;70:512 Ritzmann SE, Daniels JC. Serum Protein Abnormalities-Diagnostic and Clinical Aspects. Boston: Little, Brown & Co 1975. Tietz NW. Clinical Guide to Laboratory Tests, 2nd Philadelphia, Pa: WB Saunders. 1990:328-331 Tietz NW. Fundamentals of Clinical Chemistry, 2nd Philadelphia, Pa: WB Saunders, 1976:278-280 Wallach J, Interpretation of Diagnostic Tests, 3nd ed.Boston: Little, Brown & Co, 1978 Analyticon® Biotechnologies AG Am Mühlenberg 10, 35104 Lichtenfels / Germany (PIgM_GB-D_21_001_06.01_2015-02-18) S2/4 Turbitex IgM IMMUNOGLOBOLIN M Bestellinformation: Katalog-Nr. Hinweis: Inhalt 7981 R1 3 x 20 ml R2 Hit I / 917 H7301 R1 6 x 20 ml R2 (ILab*/ AU*) ( * ) Kit enthält nur Reagenzien-Barcodes für Hitachi Systeme. 3x 7 ml 6x 8 ml In vitro Diagnostikum. Weitere sicherheitsrelevante Informationen sind im Sicherheitsdatenblatt enthalten. Dieses steht auf unserer Homepage http://www.analyticon-diagnostics.com zum Download bereit. Die beim Umgang mit Laborreagenzien üblichen Vorsichtsmaßnahmen beachten. Einschränkungen des Verfahrens - Interferenzen: Anwendungszweck: Immunologischer Trübungstest zur quantitativen in vitro Bestimmung von IgM in Humanserum und -plasma. Zusammenfassung: IgM besteht üblicherweise aus 10 schweren -Ketten und 10 leichten Ketten (oder -Typ), letztere jedoch in einem Molekül immer uniform. Dazu kommt noch eine Verbindungskette, die alle µ-Ketten miteinander verknüpft (J-Chain), so dass vereinfacht betrachtet, ein Pentameres im Vergleich zu IgG besteht. Es ist das größte Immunoglobulin (MG = 900000), sein Anteil an den Plasmaimmunglobulinen beträgt jedoch nur 6%. IgM ist der erste spezifische Antikörper, der nach einer Infektion im Serum erscheint. Es vermag Komplement zu aktivieren und hilft damit Bakterien zu töten. Der Spiegel an IgM sinkt nach Abklingen der Infektion aber im Gegensatz zu IgG relativ schnell wieder ab. Diesen Um-stand macht man sich bei der Differentialdiagnose zwischen akuter und chronischer Infektion zunutze, indem man die Titer von spezifischem IgM mit denen von spezifischem IgG vergleicht. Überwiegt IgM, so ist die Infektion akut, überwiegt IgG, so handelt es sich um eine eher chronische Infektion (z.B. bei Rubeolen, Virus-hepatitis). Erhöhte polyklonale IgM-Spiegel werden bei viralen, bakteriellen und paraditären Infektionen, Lebererkrankungen, rheumatoider Arthritis, sklerodermie, cystischer Fibrose und Heroinsucht gefunden. Höhere Konzentrationen an monoklonalem IgM treten bei der Waldenström Makroglobulinämie auf. Erniedrigte IgMKonzentrationen findet man bei Proteinverlust-Enteropathien und Verbrennungen. Eine verminderte IgM-Synthese tritt bei kongenitalen und erworbenen Immundefizienzsyndromen auf. Der Einsatz von spezifischen Antikörpern zur Bestimmung der Serumproteine hat sich zu einem wertvollen diagnostischen Hilfsmittel entwickelt. Die lichtstreuenden Eigenschaften der Antigen-Antikörper-Komplexe wurden zuerst von Pope und Hearly 1938 beobachtet und von Gitlin und Edelhoch bestätigt. Ritchie verwendete für quantitative Proteinmessungen die turbidimetrische Bestimmung. Mit der nephelometrischen Methode lassen sich ebenfalls die Immunglobuline quantitativ bestimmen. Die Zugabe von Polyethylenglycol (PEG), wie von Lizana und Hellsing beschrieben, verstärkt die Präzipitation des Antigen-Antikörper-Komplexes und erhöht die Sensitivität des Tests. Der vorliegende Test beruht auf dem Prinzip des immunologischen Agglutinationstests. Als Bewertung gilt: Wiederfindung 10% vom Ausgangswert. Ikterus: Keine wesentliche Beeinflussung bis zu einer Bilirubin-Konzentration von 80 mg/dl. Hämolyse: Keine wesentliche Beeinflussung bis zu einer Hämoglobin-Konzentration von 1100 mg/dl. Lipämie: Erhöhte Triglycerid-Konzentrationen können die Messwerte beeinflussen. Es besteht keine zufrieden stellende Übereinstimmung zwischen Trübung und Triglyceridkonzentration. IgM gibt unter Testbedingungen keine Kreuzreaktionen mit IgG und IgA. Bei Seren mit unklarer klinischer Charakterisierung sollte eine ProteinElektrophorese vorgeschaltet werden, um einen eventuell vorhandenen Antigenüberschuss (z.B. Gammopathie) zu erkennen. Bei IgM-Konzentrationen über 10000 mg/dl kann der High-Dose-Hook-Effekt auftreten. Testverfahren: Applikationen für automatisierte Systeme sind auf Anfrage erhältlich. Gelieferte Materialien • Gebrauchsfertige Lösungen wie vorher angegeben zusätzlich benötigte Materialien • Kalibrations- und Kontrollmaterialien wie nachfolgend beschrieben •NaCl-Lösung (0,9%) Manuelle Testdurchführung: Wellenlänge: Reaktionstemperatur: Schichtdicke: Messung: Probe/Kalibrator R1 340 nm +37°C 1 cm gegen Reagenzienleerwert (RLW) RLW Probe/Kalibrator --750 µl 10 µl 750 µl Mischen. 5 Min. bei 37°C inkubieren und E1 messen. Dann zufügen: R2 250 µl 250 µl Mischen. 5 Min. inkubieren u. E2 ablesen. Berechnung: E = [(E2 –E1) Probe oder Kalibrator] – (E2 – E1) RLW] Testprinzip: Immunologischer Trübungstest • Probe und Zugabe von R1 (Puffer) • Zugabe von R2 (Anti-IgM-Antikörper/Puffer) und Start der Reaktion Anti-IgM-Antikörper reagieren mit dem Antigen aus der Probe unter Bildung eines Antigen-Antikörper-Komplexes, der nach Agglutination turbidi-metrisch gemessen wird. Die Konzentration von IgM in Patientenseren sollte aus dem E der Probe mit Hilfe eines mathematischen Modells wie logit/log berechnet oder aus einer Kalibrationskurve, beruhend auf den Messergebnissen von 6 Standards für einen Kalibrationsbereich von 0 bis 490 mg/dl IgM, abgelesen werden Für den Nullpunkt wird die Verwendung einer NaCl-Lösung (0,9%) empfohlen. Messbereich: 30 – 850 mg/dl bzw. 0,30 – 8,50 g/l* * abhängig von der höchsten angegebenen Standardkonzentration. Konzentration der gebrauchsfertigen Lösung: R1: TRIS* Puffer pH 7,8 Natriumchlorid Polyethylenglycol Konservierungsmittel R2: Anti-Human-IgM-Antikörper (Kaninchen): TRIS* Puffer pH 7,8 Natriumchlorid Konservierungsmittel 100 mmol/l 150 mmol/l 4,5 % Abhängig vom Titer 80 mmol/l 150 mmol/l *TRIS= Tris (hydroxymethyl)-aminomethan-hydrochlorid Herstellung und Haltbarkeit: R1: Inhalt ist gebrauchsfertig. R2: Inhalt ist gebrauchsfertig. Ungeöffnete Packungsbestandteile sind bei +2°C bis +8°C bis zum aufgedruckten Verfallsdatum haltbar. Onboard Stabilität bei +2°C bis +8°C: R1 90 Tage R2 90 Tage Untersuchungsgut: Serum, entnommen mit Standard-Probenentnahmeröhrchen Li-Heparinat-, Na-Heparinat- oder EDTA-Plasma Haltbarkeit: 7 Tage bei +20°C bis +25°C 3 Monate bei +4°C bis +8°C 6 Monate bei - 20°C Proben, die Präzipitate enthalten, müssen vor dem Test zentrifugiert werden. Bei höheren Konzentrationen werden die Proben manuell mit NatriumchloridLösung (0,9%) verdünnt (z.B. 1+1). Das Ergebnis ist mit dem entsprechenden Verdünnungsfaktor zu multiplizieren (z.B. Faktor 2), bzw. mit Rerun-Funktion bestimmen. Referenzbereich: IFCC CRM 470* Am Mühlenberg 10, 35104 Lichtenfels / Germany mg/dl g/l * Referenzwerte gem. CRM 470 Protein-Standardisierung Jedes Labor sollte die Übertragbarkeit der Referenzbereiche für die eigenen Patientengruppen überprüfen und gegebenenfalls eigene Referenzbereiche ermitteln. Für diagnostische Zwecke sind die IgM- Ergebnisse stets im Zusammenhang mit der Anamnese, der klinischen Untersuchung und anderen Untersuchungsergebnissen zu werten. Sensitivität (analytische Nachweisgrenze): Nachweisgrenze: 5 mg/dl bzw. 0,05 g/l Die Nachweisgrenze entspricht der niedrigsten messbaren IgM- Konzentration, die von Null unterschieden werden kann. Impräzision: Die Reproduzierbarkeit wurde mit Kontrollproben von Tag zu Tag (n = 20) bestimmt und ergab folgende Ergebnisse: Probe Probe 1 Probe 2 Probe 3 Analyticon® Biotechnologies AG 40 – 230 0,4 – 2,3 Tag / Tag MW (mg/dl) 86,74 167,23 246,43 SD (mg/dl) 2,61 4,51 5,49 VK % 3,01 2,70 2,23 (PIgM_GB-D_21_001_06.01_2015-02-18) S3/4 Turbitex IgM IMMUNOGLOBOLIN M Methodenvergleich: Bei einem Vergleich von Analyticon Turbitex IgM (y) mit einem kommerziell erhältlichen Test (x) wurden folgende Ergebnisse erhalten (mg/dl): y = 0,960 x + 6,057; r = 0,995 Qualitätskontrolle: Protein Control Level 1 Protein Control Level 2 3 x 1 ml 3 x 1 ml #7661 #7662 Die Kontrollintervalle und Kontrollgrenzen sind den individuellen Anforderungen jedes Labors und den länderspezifischen Richtlinien anzupassen. Die Ergebnisse müssen innerhalb der festgesetzten Bereiche liegen. Jedes Labor sollte Korrekturmaßnahmen für den Fall beschreiben, dass Werte außerhalb des Bereichs liegen. Kalibration für Hitachisysteme: Standardisierung: Die IgM-Methode wurde an der Referenzpräparation CRM 470 abgeglichen. S1: 0.9% NaCl ® S2-S6: Bio Cal P 3 x 1 ml #1470 ® Bio Cal P Set 5 X 1 ml #1475 Kalibrationshäufigkeit Multikalibration Eine Vollkalibration wird empfohlen: • Bei Chargenwechsel • Wenn Qualitätskontrollverfahren dies erfordern Entsorgung: Bitte beachten Sie die jeweiligen gesetzlichen Vorschriften. Literatur: 1. 2. 3. 4. 5. 6. 7. 8. 9. 10. 11. 12. 13. 14. Deutsch E, Geyer G, Wenger R. Laboratoriumsmedizin. Normalbereich der Ergebnisse und Interpretation abnormer Befunde, 3. Auflage Basel/München: Karger 1992. Gitlin D, Edelhoch H. J Immunol 11951;66:76-78 Guder WG, Narayanan S, Wisser H, Zawta B. List of Analytes Preanalytical Variabled. Brochure in: Samples: From the Patient to the Laboratory.Darmstadt: GIT-Verlag, 1996 Heidelberger M, Kendall FE. J Exp Med 1935;62:697 Henry JB. Clinical Diagnosis and Management by Laboratory Methods, II. Philadelphia: WB Saunders Co 1979 Kaplan La. Pesce AJ, /Hrsg.). Clinical Chemistry, Theory, Analysis and Correlation. St Louis: CV Mosby Co 1984 Killingsworth LM, Savory J. Clin Chem 1972;18:335 Konsensuswerte der Deutschen Gesellschaft für Laboratoriumsmedizin, der Deutschen Gesellschaft für Klinische Chemie und des Verbandes der Diagnostica-Industrie e.V. (VDGH). Clin Lab 1995;41:743-748 Lizana J Hellsing K. Clin Chem 1974;20:1181 Ritchie RF. J Lab Clin Med 1967;70:512 Ritzmann SE, Daniels JC. Serum Protein Abnormalities-Diagnostic and Clinical Aspects. Boston: Little, Brown & Co 1975. Tietz NW. Clinical Guide to Laboratory Tests, 2. Auflage Philadelphia, Pa: WB Saunders, 1990:328-331 Tietz NW. Fundamentals of Clinical Chemistry, 2. Auflage Philadelphia, Pa: WB Saunders, 1976:278-280 Wallach J, Interpretation of Diagnostic Tests, 3. Auflage ed.Boston: Little, Brown & CO, 1978 Analyticon® Biotechnologies AG Am Mühlenberg 10, 35104 Lichtenfels / Germany (PIgM_GB-D_21_001_06.01_2015-02-18) S4/4
