Embryonale Tumoren im Kindes
Werbung
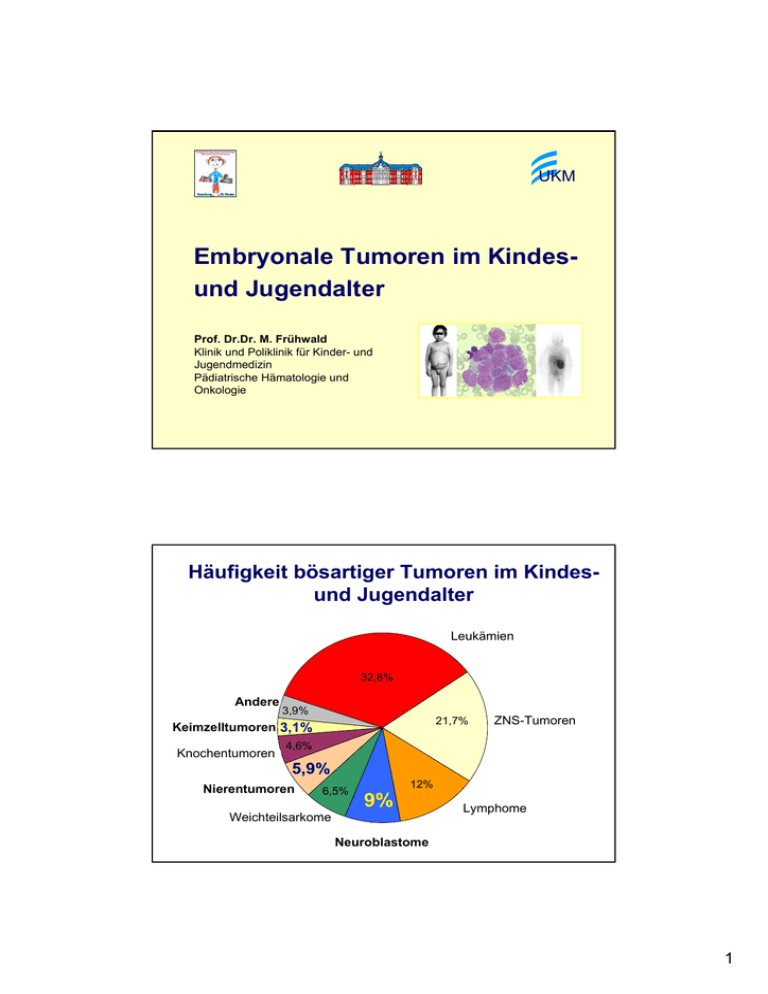
UKM Embryonale Tumoren im Kindesund Jugendalter Prof. Dr.Dr. M. Frühwald Klinik und Poliklinik für Kinder- und Jugendmedizin Pädiatrische Hämatologie und Onkologie Häufigkeit bösartiger Tumoren im Kindesund Jugendalter Leukämien 34,5% Leukämien 32,8% Andere 3,9% Andere Keimzelltumore 3,1% 3,9% 21,7% Keimzelltumoren 3,1% Knochentumore Knochentumoren ZNS-Tumoren ZNS-Tumore 19,4% 4,6% 4,6% 5,9% Nierentumore 6,5% Nierentumoren 6,5% 12% 9% Weichteilsarkome Weichteilsarkome 6,5% Lymphome Lymphome 12,8% Tumore des sympathischen NS 8,6% Neuroblastome 1 Solide Tumoren im Kindesalter Inzidenz Solide Tumoren 48% • 19 % ZNS-Tumoren – – – Astrozytom Ependymom Sonstige 8% 2% 9% • Neuroblastom • Nephroblastom (Wilms-Tu) • Weichteilsarkome – – • (1,4 / 100.000 / Jahr) (0,9 / 100.000 / Jahr) 6% Rhabdomyosarkom Sonstige 4% 2% Knochentumoren 5% – – – • • • • 9% 5,9 % Osteosarkom Ewing-Sarkom Sonstige 3% 2% <1 % Keimzelltumoren Retinoblastom Lebertumoren Karzinome / Sonstige ~ 15% der pädiatrischen Malignome ~2,3/100.000/Jahr 3,1 % 2% 1% 1% Neuroblastom Epidemiologie • häufigster solider Tumor im Kindesalter • 0-3 (-5) Jahre (Rarität bei Erwachsenen) • m : w = 1,4 : 1 • 1,1 / 100.000 / Jahr • selten familiär • Assoziation mit Turner-Syndrom, M. Hirschsprung, Neurofibromatose Typ I, Hemihypertrophie-Syndromen 2 Neuroblastom Lokalisation Sympathikus/ Grenzstrang thorakal ~15% Hals 5% abdominell~25% Brust 15% Abdomen 25% Nebenniere 50% 45 % Becken 5% Metastasen 45% KM, Knochen, LK, Leber, ZNS, Haut (Stad. 4s) Neuroblastom Klinisches Bild • Brillenhämatom (Stadium 4) • Querschnitt-Symptomatik • Horner-Syndrom • Opsomyoklonus-Syndrom • Hypertonie, Durchfall (VIP-Syndrom) • ... 3 Neuroblastom Klinisches Bild Kardinalsymptom Bauchtumor Neuroblastom Drohender Querschnitt 4 Neuroblastom MYCN-Amplifikation FISH MYCN Chromosomenanalyse “dmin” double minutes Überlebensraten mit und ohne MYCNAmplifikation Neuroblastom Diagnostik • Katecholamine im Urin/Serum Vanillinmandelsäure, Homovanillinsäure ! • Knochenmarkzytologie • Sonographie • mIBG-Szintigraphie (HED-PET) • Computertomographie • MRT 5 Neuroblastom Knochenmarkzytologie Homer-Wright Rosetten Blastenbild GD2-Antikörper Neuroblastom mIBG-Szintigraphie mIBG Tc mIBG Tc mIBG Tc 6 Neuroblastom Stadium IV Neuroblastom Pathologie Ganglioneurom Ganglioneuroblastom Neuroblastom 7 Neuroblastom MYCN-Amplifikation “HSR” homogeneously staining region FISH MYCN “dmin” double minutes Neuroblastom Entstehungsmodell 8 Neuroblastom International Neuroblastoma Staging System - INSS - 1 2b 4 2a 3 4s 4s: MibG im KM -, gute Prognose, Spontanregression Neuroblastom Risikogruppen I MYCN normal, Säuglinge St. 1-3, 4s, >1 J. St. 1,2r = Beobachtungs-Patienten II MYCN normal, Säuglinge St. 1-3 + Sympt. >1 J. St. 2nr,3 = Standardrisiko-Patienten III MYCN amplifiziert und/oder Stadium 4 (jedes Alter) = Hochrisiko-Patienten 9 Neuroblastom “low risk” Therapie stabile Erkr. Beobachtung 12 Monate / bis Ende 2. LJ stabile Erkr., Regression: Therapieende Beobachtung Progress lokal N4 N4 Stadium 4 N4 N4 max 4 x N4, bei Progress MRG HR-Gruppe Low risk St. 1, MYCN – St. 2, 1p OK, MYCN – St. 3 bis 2 J., 1p OK, MYCN – St. 4s bis 1 J., MYCN- Neuroblastom “high risk”-Therapie High risk St. 4 > 1Jahr MYCN pos. jedes Alter mIBGTherapie N5 N6 N5 N6 N5 N6 HDCT Strahlentherapie 13-cis-RA 13-cis-RA 10 Neuroblastom Bestrahlungsplanung Neuroblastom Prognose Alter Stadium < 1 J. > 1 J. Anteil 5-JÜR 1-3 61 % 95 % 4 13 % 53 % 4S 26 % 79 % 1-3 45 % 76 % 4 55 % 20-40 % 11 Neuroblastom Offene Fragen • Sinn eines Screenings – (wahrscheinlich) nicht effektiv! (Schilling 2002, N Engl J Med) • Rolle der Hochdosistherapie – (wahrscheinlich) effektiv (Berthold 2005, Lancet Oncol) ? Rolle von Radiotherapie Retinsäuretherapie mIBG-Therapie Spätfolgen Pause 12 Tumor li. Oberbauch Neuroblastom Wilms-Tumor Wilms-Tumor = Nephroblastom Epidemiologie und Vererbung • 0-5 Jahre • m / w = 0.9 / 1 • 0,9 / 100.000 / a • WT1 (11p13), WT2 (11p15.5), WT3 (16q), ... • LOH 1p, 11p, 16q, 22q prognostisch ungünstig • LOH 22q, 19q mit Anaplasie assoziiert • TP53 bei Anaplasie inaktiviert • FWT1 (17q), FWT2 (19q), ... • del (22q11.2) im Rhabdoid Tumor 13 Wilms-Tumor Klinisches Bild Wilms-Tumor Klinisches Bild 100% 80% Vorsorge Tumorschwellung 56 % Sonstige Schmerz 25 % Hämaturie 18 % Fieber 10 % 60% 40% 20% Tumorsymptomatik Harnwegsinfekt 6% Gewichtsstillstand / -abnahme 5% Obstipation 6% Durchfall 4% Erbrechen 0% Sonstige 6% 19 % 14 Hemihypertrophie-Syndrom • Assoziation mit Neuroblastom, Nephroblastom, NN-Karzinom, Hepatoblastom • Bis zum 5. LJ alle 3 Monate nachsorgen Wilms-Tumor Assoziierte Syndrome BWS UGM 2,2% HH 33,3% 13,3% Aniridie ohne 87,6% mit 4,4% 12,4% Drash 4,4% familiär 4,4% andere 37,8% Beckwith-Wiedemann, WAGR (Aniridie, Gigantismus, Retardierung), Neurofibromatose, Denys-Drash, Perlman, Hemihypertrophie ... 15 Wilms-Tu Differentialdiagnosen Malignome: Neuroblastom Adenokarzinom der Niere Lymphom Langerhans-Zell-Histiozytose Teratom Gutartige Erkr.: Nieren-Abszess Nieren-Fibrom Hämatom Hydronephrose Zystadenom Ganglioneurom Hamartom Wilms-Tu Bildgebung Sonographie CT MRT 16 Wilms-Tumor Ausscheidungsurographie AUG 15 min Wilms-Tumor Lokalisation Metastasen 5% bilateral 17 Wilms-Tumor Pathologie Blastem, Stroma, Tubuli Wilms-Tumor Entwicklungsbiologie Nephroblastomatose 18 Wilms-Tumor Staging Stadium I: nur Niere, komplett entfernt II: über Niere hinaus, komplett entfernt Wilms Tu III: lokale Metast., Tu nicht entfernt IV: Fernmetastasen V: bilateraler Tumor Wilms-Tumor Klinische Daten zeitgleich an Referenzradiologie Diagnostisches Vorgehen Anamnese Klinischer Befund Labordiagnostik (Serum, Urin) Katecholamine !!! Sonographie Röntgen-Thorax Diagnose gesichert Bildversand an Referenzradiologie MRT (oder CT) Diagnose gesichert mIBG Diagnose gesichert Feinnadelbiopsie Beginn der präoperativen Chemotherapie Diagnose über Referenzradiologie gesichert 19 Nephroblastom Therapie SIOP 2001 / GPOH Wilms-Tumor Präoperative Therapie 20 Wilms-Tumor Postoperative Therapie Low risk Intermediate risk High risk + > 500 ml IR Std. I Std. II Std. III Keine Therapie VCR / ACT-D 28 Wochen VCR / ACT-D 28 Wochen VCR / ACT-D 4 Wochen Randomisation + / - ADR AVA 28 Wochen HR + Strahlenth. Randomisation + / - ADR + Strahlenth. HR + Strahlenth. 1 Wilms-Tumor Verlauf unter Chemotherapie 14.08. 27.03. 11.09. 25.07. 21 Nephroblastomatose • Nephritogene Reste • prä-maligne Läsion • Chemotherapie wie bei Wilms-Tu • keine Radiatio, Versuch Nephrektomie zu vermeiden Wilms-Tu Prognose • 85 % Überlebensrate • 15 % Rezidive Systemisches Rezidiv Lokalrezidiv Kombiniertes Rezidiv 22 Wilms Tumor - Nephroblastom Heilungsraten seit 1915 100 80 60 40 1915 10 % 25 % operative Mortalität 1925 15 % 20 % operative Mortalität 1935 30 % <5 % operative Mortalität 1945 45 % postoperative Radiatio 1965 70 % Chemotherapie 1985 80 % risikoadaptierte Therapie und prospektive randomisierte Studien 2000 90 % molekularbiologische Marker 20 0 1910 1920 1930 1940 1950 1960 1970 1980 1990 2000 Keimzelltumoren bei Kindern und Jugendlichen ZNS 20 % Ovar 30 % Testis 20 % Steiss 20 % andere 10 % MAHO/MAKEI/SIOP 23 Tumor Lokalisation nach Alter 1442 Patienten 200 180 160 Testis 140 Ovary 120 100 Non-gonadal 80 60 40 20 0 1 2 3 4 5 6 7 8 9 10 11 12 13 14 15 16 Alter bei Diagnose (Jahre) Schneider et al. Pediatric Blood and Cancer 2004 Bedeutung der kompletten Entfernung 1.0 Komplett: 0.94±0.04 0.8 Microskopische Reste 0.72±0.11 0.6 Makroskopische Reste: 0.41±0.16 0.4 0.2 p=0.0001 0 0 12 24 36 48 60 72 84 96 108 120 EFS (Monate) 24 Überleben Patienten > 10 Jahre mit Metastasen 1 p 0,8 0.77±0.09 0,6 gonadal non-gonadal 0,4 0,2 0.13±0.12 0 0 12 24 36 48 60 72 84 96 108 120 Monate p<0.01 • Neuroblastom, Nephroblastom, Hepatoblastom, Retinoblastom, Keimzelltumoren • Prädisponierende Syndrome – Hemihypertrophiesyndrome (z.B. Beckwith-Wiedemann) • DD Neuroblastom - Nephroblastom: – Katecholamine i.U., mIBG-Szintigraphie – Bildgebung • Sonderfall: - Stadium 4s Neuroblastom mit guter Prognose, MiBG KM • Prognose: heilbar 25
